

Infographics made
for Texty agency
Citygraph
Citygraph is a chart to visualize and analyze urban structure. It is based on a 3D model of a city. All buildings have exaggerated heights and shifted on map to a 10-kilometer zone (to reduce perspective distortion).
You can use Citygraph to compare cities with each other, evaluate and analyze urban strategies, the level of urbanization, and more.

Kyiv patterns
Each Kyiv district has its own unique pattern formed from houses. All of them are shown separately on this poster which was also transformed into online game.

School reform
Data-art based on a project about the school reform in Ukraine. It shows all schools in Kyiv and how many addresses are listed to each of them.

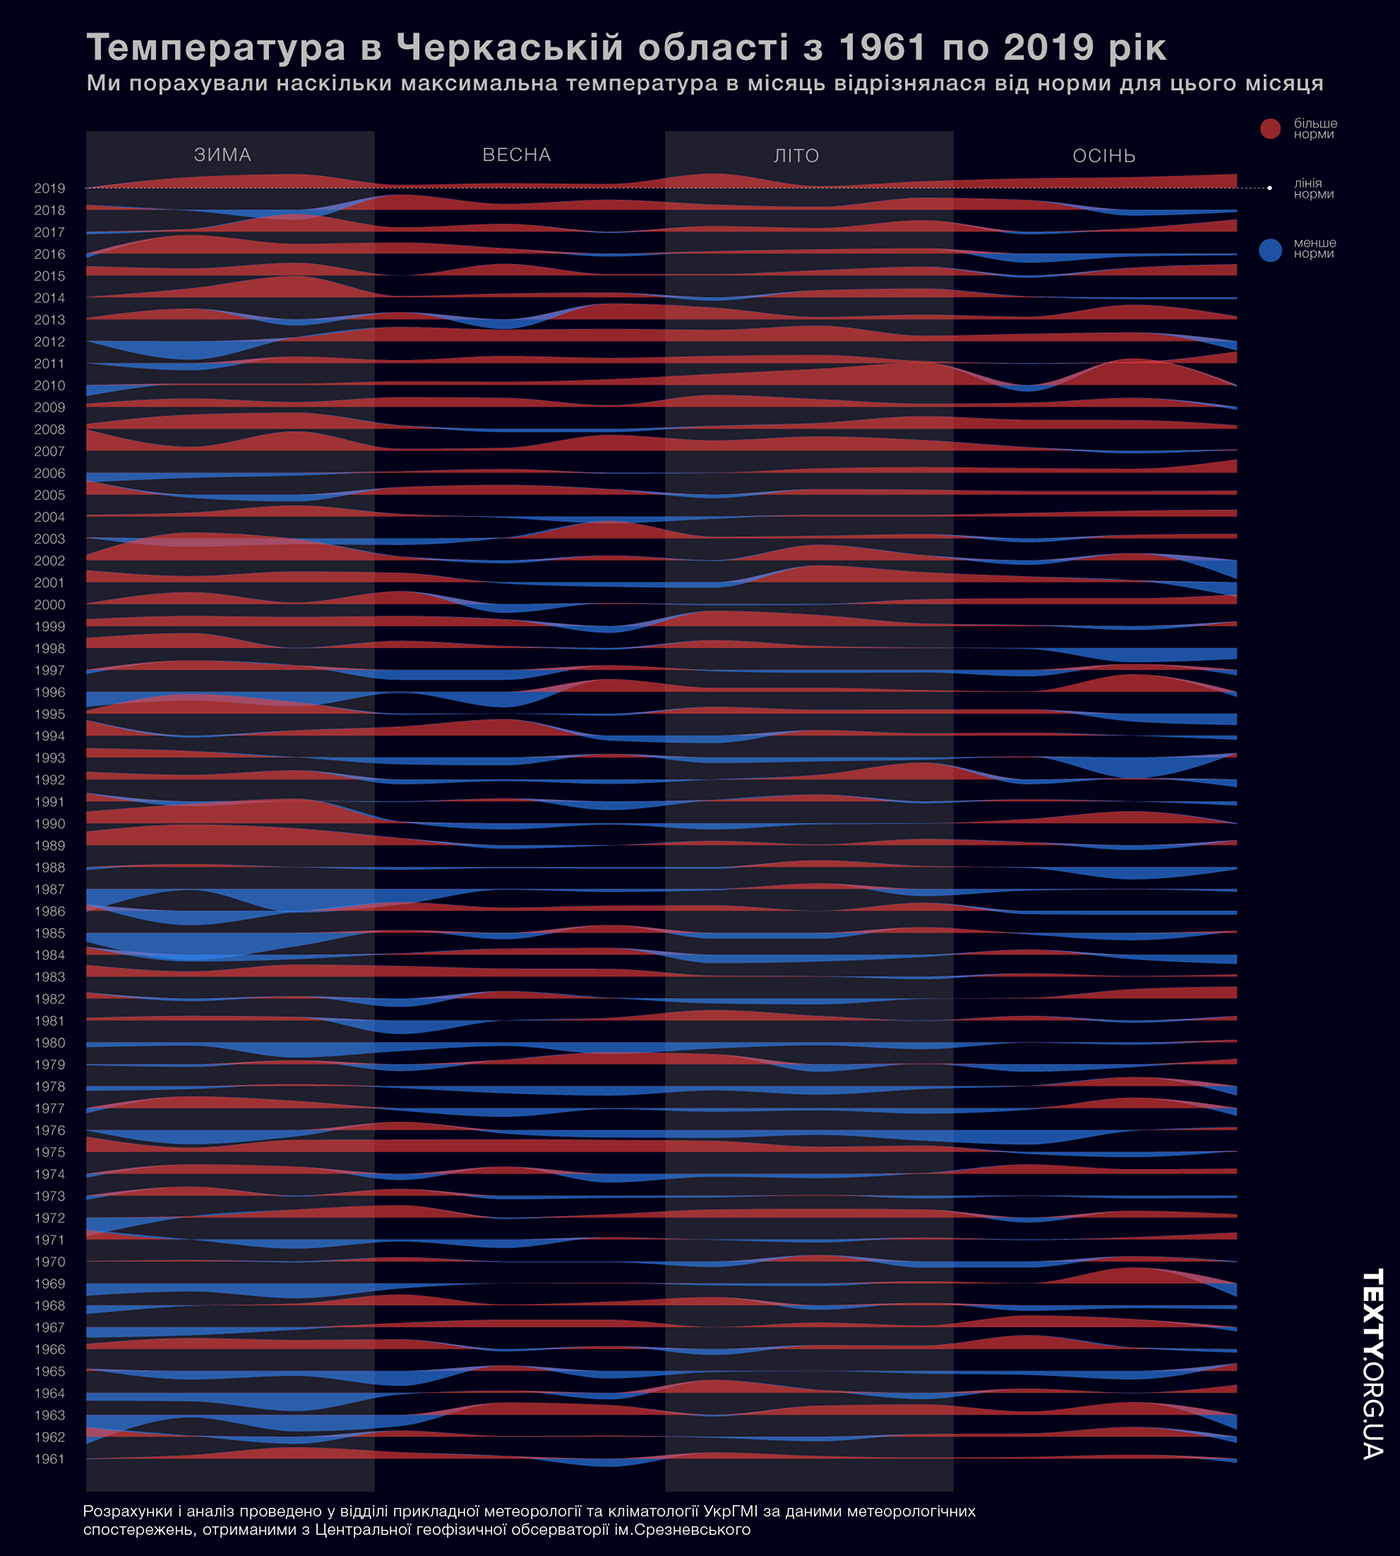
Hot summer 2019
The graph of deviations from the year average temperature in Cherkasy region (Ukraine) during the period from 1961 to 2019.
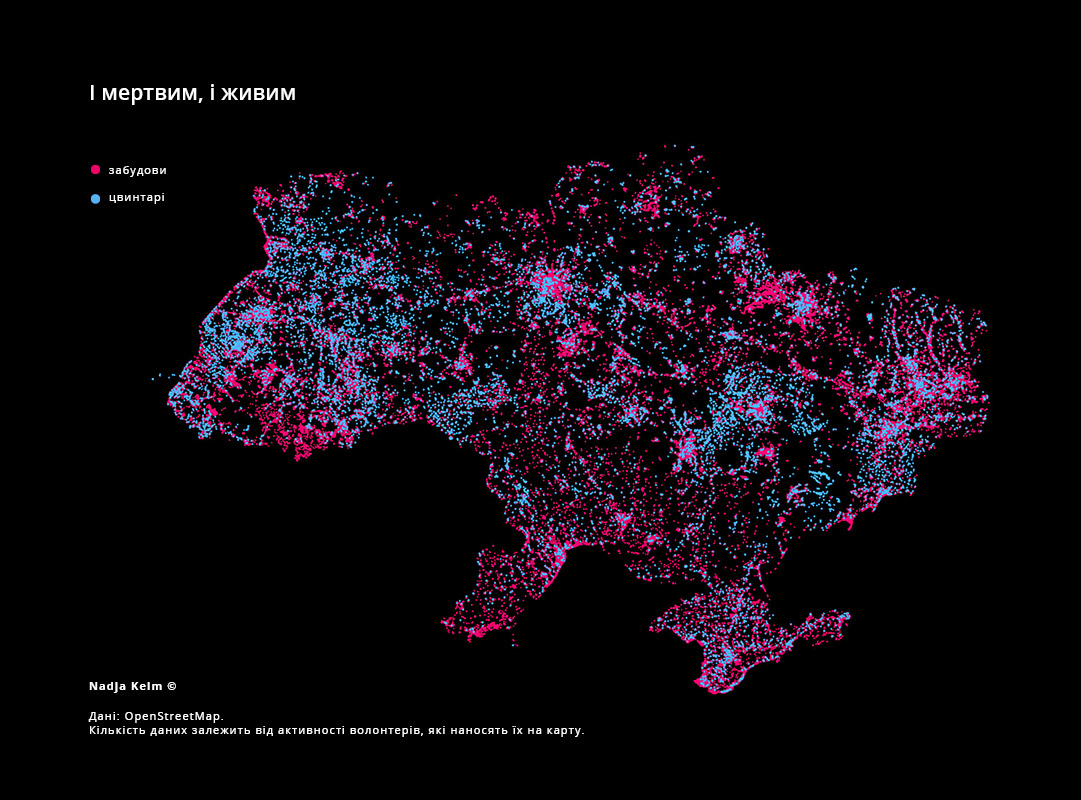
To living and dead
A fun map made during the boom of the television series Game of Thrones. It shows cemeteries and residential areas to avoid invasion of White Walkers.
Exam joy plot
A graph of results of the school graduation math exam in 2017, Kyiv.


